Training

We want to grow capacity for data-driven and applied digital research across the disciplines, so skills development and training is central to our ambitions. Our programme is aimed at and taught by researchers in the arts, humanities and social sciences. We offer a wide range of learning opportunities from introductory courses on coding to hands-on classes, and from challenge-led collaborative work to monthly deep-dives into a vast range of digital methods.  We welcome suggestions for training events and pathways: just get in touch and let us know what you’d like to see on our programme.

Training Image

Our Training Programme

Graphic for a workshop titled ‘Foundations of Sentiment Analysis.’ The background is a sepia photograph of people working at desks in a large hall with overhead lamps. A large green ampersand featuring an illustration of Ada Lovelace is placed on the left. The logo of the Centre for Data, Culture & Society (DCS) appears in the top right corner.

Silent Disco: Foundations of Sentiment Analysis

Graphic for a workshop titled ‘Working Collaboratively Through Version Control.’ The background is a black-and-white photograph of people weaving on large looms. A large magenta ampersand featuring an illustration of Ada Lovelace is placed on the left. The logo of the Centre for Data, Culture & Society (DCS) appears in the top right corner.

Working Collaboratively through Version Control

Graphic for a workshop titled ‘Foundations of Webscraping.’ The background is a black-and-white photograph of students working together in a design studio with maps and models. A large teal ampersand featuring an illustration of Ada Lovelace is placed on the left. The logo of the Centre for Data, Culture & Society (DCS) appears in the top right corner.

Collecting Data from the Web: Foundation of Webscraping

Graphic for an event titled ‘BYOD Festival.’ The background is a black-and-white photograph of people sitting around a table, drinking tea and playing cards. A large magenta ampersand featuring an illustration of Ada Lovelace is placed on the left. The logo of the Centre for Data, Culture & Society (DCS) appears in the top right corner.

Bring Your Own Data (BYOD) Fest

Graphic for a workshop titled ‘Data Viscualisation’ The background is a collage of historical printed text with an overlaid image of a wolf. A large green ampersand featuring an illustration of Ada Lovelace is placed on the left. The logo of the Centre for Data, Culture & Society (DCS) appears in the top right corner

Digital Method of the Month: Data Visualisation

Graphic for a workshop titled ‘Text Classification in Practice: From Topic Models to Transformers.’ The background shows handwritten historical letters. A large green ampersand featuring an illustration of Ada Lovelace is placed on the left. The logo of the Centre for Data, Culture & Society (DCS) appears in the top right corner.

Text Classification in Practice: From Topic Models to Transformers

Graphic for a workshop titled ‘Using API for Research.’ The background is a black-and-white photograph of people working with printing equipment and patterned sheets. A large magenta ampersand featuring an illustration of Ada Lovelace is placed on the left. The logo of the Centre for Data, Culture & Society (DCS) appears in the top right corner.

Using API for Research

Graphic for a workshop titled ‘Introduction to Geographical Data with QGIS.’ The background shows an old map of the world with detailed illustrations. A large teal ampersand featuring an illustration of Ada Lovelace is placed on the left. The logo of the Centre for Data, Culture & Society (DCS) appears in the top right corner.

Intro to Geographical Data with QGIS

Graphic for a workshop titled ‘Using Prompting Efficiently for Research.’ The background shows an aged, torn book page with visible text. A large green ampersand featuring an illustration of Ada Lovelace is placed on the left. The logo of the Centre for Data, Culture & Society (DCS) appears in the top right corner.

Using Prompting Efficiently for Research

Graphic for a workshop titled ‘Getting Started with Descriptive Statistics.’ The background is a black-and-white photograph of people reading and working in a library. A large magenta ampersand featuring an illustration of Ada Lovelace is placed on the left. The logo of the Centre for Data, Culture & Society (DCS) appears in the top right corner.

Getting Started with Descriptive Statistics

Graphic for a workshop titled ‘Getting Started with Inferential Statistics.’ The background is a black-and-white photograph of people studying in a library with partitioned desks. A large teal ampersand featuring an illustration of Ada Lovelace is placed on the left. The logo of the Centre for Data, Culture & Society (DCS) appears in the top right corner.

Getting Started with Inferential Statistics

Graphic for a workshop titled ‘From Images to Text: Working with OCR.’ The background shows handwritten text overlaid on stacked paper. A large teal ampersand featuring an illustration of Ada Lovelace is placed on the left. The logo of the Centre for Data, Culture & Society (DCS) appears in the top right corner.

From Images to Text: Working with OCR

Graphic for a workshop titled ‘Network Analysis with Gephi.’ The background shows a dark diagram with handwritten-style network terms. A large green ampersand featuring an illustration of Ada Lovelace is placed on the left. The logo of the Centre for Data, Culture & Society (DCS) appears in the top right corner

Network Analysis from Scratch: Intro to Gephi

Graphic for a workshop titled ‘Network Analysis.’ The background is a collage of historical printed text with an overlaid image of a wolf. A large green ampersand featuring an illustration of Ada Lovelace is placed on the left. The logo of the Centre for Data, Culture & Society (DCS) appears in the top right corner.

Digital Method of the Month: Network Analysis

raphic for a workshop titled ‘Getting Started with R for Research.’ The background is a black-and-white photograph of women working at long tables with tools and machinery. Overlaid is a large magenta ampersand featuring an illustration of Ada Lovelace. The logo of the Centre for Data, Culture & Society (DCS) appears in the top right corner.

Getting Started with R for Research

Promotional graphic for a workshop titled ‘Getting Started with Python for Research.’ The background is a black-and-white photograph of people screen-printing in a studio. Overlaid is a large teal ampersand featuring an illustration of Ada Lovelace. The logo of the Centre for Data, Culture & Society (DCS) appears in the top right corner.

Getting Started with Python for Research

Regression and Mixed Effect Modelling mashup

Regression and Mixed Effects Modelling

Advanced Uses of LLM

Advanced Uses of LLMs

Beyond Social Networks with Gephi

Beyond Social Networks: Advanced Uses of Gephi in Humanities Research

An Introduction to Machine Learning

An Introduction to Machine Learning

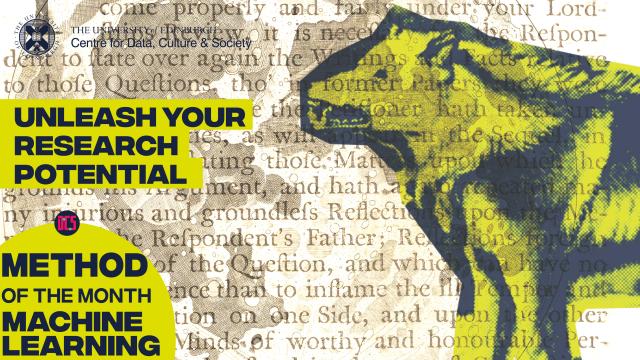
Digital Method of the Month. Machine learning

Digital Method of the Month: Machine Learning

Introduction to Bayesian Statistics

Introduction to Bayesian Statistics

Introduction to Network Analysis with Gephi

Introduction to Network Analysis with Gephi

Null Hypothesis Testing in R

Null Hypothesis Testing in R

A Gentle Introduction to Causal Inference

A Gentle Introduction to Causal Inference

Analysing Spatial Dynamics with GIS and R

Analysing Spatial Dynamics with GIS and R

Introduction to Topic Modelling with Bert

Introduction to Topic Modelling with Bert

Gale Digital Scholar Lab Workshop

Gale Digital Scholar Lab Workshop

Interactive Analysis Reports with R Markdown

Interactive Analysis Reports with R Markdown

Processing Geographical Data in QGIS

Processing Geographical Data in QGIS

Introduction to Databases and SQL

Silent Disco: Introduction to Databases and SQL

Introduction to Text Analysis with Python

Introduction to Text Analysis with Python

Analysing Polarisation in Political Texts

Analysing Polarisation in Political Texts

text analysis

Digital Method of the Month: Text Analysis

Sentiment Analysis

Silent Disco: Introduction to Sentiment Analysis

Introduction to Programming with Python

Introduction to Programming with Python

Introduction to Programming with R and RStudio

Introduction to Programming with R and RStudio

Introduction to Text Analysis

Silent Disco: Introduction to Text Analysis

Network Analysis

Digital Method of the Month: Network Analysis

Explore Unstructured Data: The Secret World of XML

Explore Unstructured Data: The Secret World of XML

Introduction to Data Analysis in Python

Introduction to Data Analysis in Python

Good Data Visualisation with R

Good Data Visualisation with R

Data Carpentry: From Data Wrangling to Data Visualisation

Data Carpentry: From Data Wrangling to Data Visualisation

Efficient Prompting for Generative AI Tools

Efficient Prompting for Generative AI Tools

Build Your Personal or Project Website with GitHub Pages

Build Your Personal or Project Website with GitHub Pages

Intro to GIS

Introduction to Geospatial Data and QGIS

Scraping websites with R

Scraping Websites with R

& sign with a drawing of a woman inside it, overlaid over pictures of old paper sheets. Text says "Legal and ethical issues in webscraping".

Legal and Ethical Issues in Webscraping

Data Visualisation

Digital Method of the Month: Data Visualisation

Introduction to Programming with Python

Introduction to Programming with Python

Introduction to Programming with R and RStudio

Introduction to Programming with R and RStudio

Sentiment Analysis

Silent Disco: Sentiment Analysis

Beyond Social Networks: Advanced Uses of Gephi in Humanities Research

Beyond Social Networks: Advanced Uses of Gephi in Humanities Research

Null Hypothesis Testing in R

Null Hypothesis Testing in R

Regression and Mixed Effects Modelling

Regression and Mixed Effects Modelling

Introduction to Text Analysis

Silent Disco: Introduction to Text Analysis

Introduction to Bayesian Statistics

Introduction to Bayesian Statistics

Analysing Spatial Dynamics with GIS and R

Analysing Spatial Dynamics with GIS and R

Interactive Analysis Reports with R Markdown

Interactive Analysis Reports with R Markdown

Introduction to Machine Learning with Python

Introduction to Machine Learning with Python

Machine Learning

Digital Method of the Month: Machine Learning

Introduction to Topic Modelling

Introduction to Topic Modelling with Bert

AI and Ethics

AI and Ethics

How to Generate Better Spatial Data Visualisation

How to Generate Better Spatial Data Visualisation

Network Analysis with Gephi

Introduction to Network Analysis with Gephi

A Gentle Introduction to Causal Inference

A Gentle Introduction to Causal Inference

3D Scanning

Digital Method of the Month: 3D Scanning

Creating Custom Data Visualisations with Observable Notebooks & D3

Creating Custom Data Visualisations with Observable Notebooks & D3

How to Create a WebGIS

How to Create a WebGIS

Network Analysis

Digital Method of the Month: Network Analysis

From SPSS to R: How to Make Your Statistical Analysis Reproducible

From SPSS to R: How to Make Your Statistical Analysis Reproducible

Introduction to Text Analysis with Python

Introduction to Text Analysis with Python

Geocoding Historical Data with QGIS

Silent Disco: Geocoding Historical Data with QGIS

Efficient Prompting for Generative AI Tools

Efficient Prompting for Generative AI Tools

Introduction to Programming with R and RStudio

Introduction to Programming with R and RStudio

Introduction to Programming with Python

Introduction to Programming with Python

Silent Disco: Intro to Databases and SQL

Silent Disco: Introduction to Databases and SQL

Good Data Visualisation with R

Good Data Visualisation with R

text analysis

Digital Method of the Month: Text Analysis

Build Your Personal or Project Website with GitHub Pages

Build Your Personal or Project Website with GitHub Pages

Working on Digitised Manuscripts with Transkribus

Working on Digitised Manuscripts with Transkribus

Make the Best of Formatting Your Writing

Make the Best of Formatting Your Writing: Intro to LaTeX and Overleaf

Image to Tech: Introduction to Text Extraction

Image to Tech: Introduction to Text Extraction

Preregistration

Digital Method of the Month: Preregistration

Digital Method of the Month: Open Research

Digital Method of the Month: Open Research

Corpus Analysis with AntConc

Silent Disco: Corpus Analysis with AntConc

Much Ado About Nothing: Missing Data in Research

Much Ado about Nothing: Missing Data in Research

Data Science in the Wild Analysing Data with Python

Data Science in the Wild: Analysing Data with Python

Data Carpentry: From Data Wrangling to Data Visualisation

Data Carpentry: From Data Wrangling to Data Visualisation

Intro to GIS

Introduction to Geospatial Data and QGIS

Silent DIsco: Intro to Markdown

Silent Disco: Introduction to Markdown

Effective Data Visualisation

Silent Disco: Effective Data Visualisation

Scraping Websites with R

Scraping Websites with R

Where to find spatial data

Where to Find Spatial Data

Legal and Ethical Issues in Webscraping

Legal and Ethical Issues in Webscraping

Introduction to Programming with R and RStudio

Introduction to Programming with R and RStudio

Introduction to Programming with Python

Introduction to Programming with Python

Data Visualisation

Digital Method of the Month: Data Visualisation

AI Ethics Mashup

AI and Ethics

Mixed Effects Modelling with R Mashup

Regression and Mixed Effects Modelling with R

Digital Method of the Month Mashup

Digital Method of the Month: Open Research

image mash up using canva

Recording 3D Data: Lidar Scanner Tutorials

image mash up using canva

Systematic Data Cleaning in Python

Spatial Data

Analysing Spatial Dynamics with GIS and R

image mash up using canva

Silent Disco: Sentiment Analysis with Python

Topic Modelling Mashup

Advanced Text Analysis: Topic Modelling with Python

image mash up using canva

Digital Method of the Month: Text Analysis

image mash up using canva

Natural Language Processing with R

image mash up using canva

Silent Disco: Introduction to Text Analysis

Person using MacBook Pro

Natural Language Processing with SpaCy

Digimap

How to Create a WebGIS

NTF inscription on cubes against the background of dollars and microcircuits

NFT (Non-Fungible Tokens) 101

A 3D printer in action

Walking Tour of the 3D Printing Facilities

image mash up using canva

From Photos to 3D Models. Introduction to Photogrammetry

text with annotations

Collecting and Handling Open-Source Data for Natural Language Processing

Graphic mashup of manuscript and event description

Digital Method of the Month: 3D Scanning

Data Visualisation of London

How to Generate Better Spatial Data Visualisation

image mash up using canva

Introduction to Machine Learning

image mash up using canva

Digital Method of the Month: Machine Learning

Patterns

Finding Patterns Across Data

image mash up using canva

Working with OCR

Silent Disco Mashup

Silent Disco: Cleaning OCR'd Data with Regex

R Logo and code

Analysing Geospatial Data with R

image mash up using canva

Digital Method of the Month: Statistics

copyright meshup

Copyright 101

Databases mashup

Silent Disco: Introduction to Databases with SQLite

Networking Analysis Gephi Mashup

Network Analysis with Gephi

Web scraping mashup

Scraping Web Forums with R

Network Analysis Mashup

Digital Method of the Month: Networking Analysis

Geospatial Data Mashup

Introduction to QGIS and Geospatial Data

Git and Github Mashup

Version Control with Git and GitHub

Silent Disco

Silent Disco: Cleaning Data with OpenRefine

A 3D printer in action

Designing and Handling 3D Data for Printing

Data Vis with R Mashup

How to Generate Good Data Visualisations with R

Visualising Spatial Data Mashup

Where to Find Spatial Data

Latex Training Event

Make the Best of Formatting Your Writing: Intro to LaTeX and Overleaf

Autocad Mashup

Digital Drawing with AutoCAD

Data Carpentry for Social Scientists

Data Carpentry: From Data Wrangling to Data Visualisation

Silent Disco

Silent Disco: Introduction to Markdown Syntax

Digital Method of the Month Mashup

Digital Method of the Month: Digital Drawing

Data Science in the Wild Mashup

Data Science in the Wild

Machine Learning Mashup

Introduction to Programming with Python

R Logo and code

Introduction to Programming with R and RStudio

Data Visualisation mashup

Silent Disco: Effective Data Visualisation

Data Visualisation mesh

Digital Method of the Month: Data Visualisation

Ada Lovelace mashup

Autumn 2022 Training Information Session

Web scraping mashup

Web Scraping with RVest

Autocad and QGIS Mashup

Interfacing Autocad and GIS

Autocad 3D mashup

Working with 3D data with Autocad

Silent Disco Mashup

Silent Disco: Cleaning Data with OpenRefine

Digital Method of the Month Mashup

Digital Method of the Month: Preregistration

Books Mashup

Text Analysis with Python’s NLTK Library

Laser Scanner Mashup

Recording 3D Data: Lidar Scanner Tutorials

Machine Learning Mashup

Machine Learning with Python

Digital Method of the Month Mash up

Digital Method of the Month: Machine Learning

Autocad Mashup

Digital Drawing with Autocad

Graphs mashup

Analysing Structured Data with Python’s Pandas and ElementTree Libraries

Silent Disco Mashup

Silent Disco: Corpus analysis with Antconc

Laptops on desk

Further text Analysis

Copyright Mashup

Copyright 101: An introduction

Image of map with pink overlay and dots

How to create a WebGis

A 3D printer in action

Designing and handling 3D data for 3D printing

Statistics Mashup

Mixed Effects Modelling with R

Machine Learning Mashup

Introduction to Python 

Graphic mashup of manuscript and event description

Digital Method of the Month: 3D Scanning

Statistics Mashup

Regression with R

Statistics Mashup

Null Hypothesis Testing and Simulation with R

Statistics Mashup

Intro to Statistic and Descriptive Statistics

Silent Disco mashup

Silent Disco: Intro to Beautiful Soup

Image of map with blue overlay and dots

Where to find Spatial data

Data Visualisation of London

Spatial Data Visualisation

Silent Disco mashup

Silent Disco: Understanding Regular Expressions

R Logo with green background

Introduction to R and R Studio

Graphic mashup of manuscript and event description

Digital Method of the Month: Statistics

R Logo and code

Geospatial Data in R

Training Event

Using Latex and Overleaf to write articles and longer pieces of written work

Digital Method of the Month Mash-up

Digital method of the month: 3D Printing

R Logo and code

Logical Statements and Loops in R

Digital Method of the Month Mashup

Digital Method of the Month: Text Analysis

Python Design

Introduction to Programming in Python

R Logo and code

Introduction to Tidyverse

Gale Digital Scholar Lab Mashup

Gale Digital Scholar Lab workshop

Map and grid graphic mashup

Working with Historical Maps

Graphic mashup

Web scraping News Sites with Python

R Logo and code

Data Visualisation with R

Girl using virtual reality headset

Introduction to Sentiment Analysis

Laptops on desk

Introduction to text analysis

Data Visualisation mashup

Effective Data Visualisation

Databases mashup

Introduction to databases with SQLite

Python Design

Introduction to Programming in Python

Data Visualisation mesh

Digital Method of the Month: Data Visualisation

R Logo and code

Introduction to R and R Studio

Lighthouse over old etching of Leith docks

Data and Text Analysis Summer School

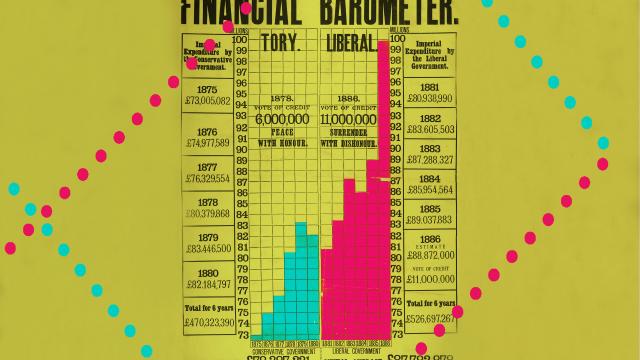
Data visualisation of finance document

Workshop: Effective Data Visualisation

Girl using virtual reality headset

Introduction to Sentiment Analysis

Bookshelves and CDCS and Carpentry logo

Library Carpentry: R

Pink graphic from Unity

Introduction to Real-time Rendering and 3D Visualisation in Unity

Headphones, laptop, CDCS logo

Silent Disco: The Sound of Data

Bookshelves and CDCS and Carpentry logo

Library Carpentry: Python

Stats and GIS

R & QGIS: Integrating Statistical and Spatial Data Analysis

Graphic mashup of manuscript and event description

Digital Method of the Month: Databases

LiDAR scan of outside venue

Recording 3D Data: Photogrammetry with 3DF Zephyr

Bookshelves and CDCS and Carpentry logo

Library Carpentry: Unix Shell

LiDAR scan of outside venue

Recording 3D Data: LiDAR Scanning Tutorials

Headphones, laptop, CDCS logo

Silent Disco: Getting Started with Markdown

Bookshelves and CDCS and Carpentry logo

Library Carpentry: OpenRefine

Graphic mashup of manuscript and event description

Digital Method of the Month: 3D Scanning

Data Visualisation of London

Spatial Data Visualisation: Advanced Techniques in QGIS

Screen capture of R

Visualisation and Statistics with R

Copyright logo, CDCS logo, SSI logo

Copyright and Licenses

Graphic mashup of manuscript and event description

Digital Method of the Month: Machine Learning

Data visualisation of UK

Data Visualisation Techniques

Illustration of rabbit with antlers and wings

Introduction to Transkribus and OCR

Interior view of library with many floors

Introduction to Managing Digitalised Documents

Python Design

Introduction to Programming in Python

Graphic mashup of manuscript and event description

Digital Method of the Month: Text Analysis

Graphic mashup of drawers and CDCS logo

Introduction to Databases with SQLite

Training Event

Data Visualisation with R and RStudio

Event title next to image of wolf

Digital Method of the Month: Data Visualisation

Graphic mashup

Training: Further Text Analysis

Laptop with Data Carpentry and CDCS logos

Course: Data Carpentry for Digital Humanities

Headphones, laptop, CDCS logo

Silent Disco: Understanding Regular Expressions

Map and grid graphic mashup

Introduction to Spatial Data & GIS

Notebook mashup

Training: Introduction to Textual Analysis

Graphic mashup of manuscript and event description

Digital Method of the Month: GIS

Python Design

Course: Python for Beginners

Graphic mashup

Web Scraping News Sites with Python

Laptops on desk

Training: Python Library Series

Map and grid graphic mashup

Training: Working with Historical Maps in Digimap

Event Title on black background

Visualizing your Data Using R

Overhead view of laptops being used on a table

Workshop: Collecting Social Media Data

Training Event

Training: Statistics and Visualisation with R

Graphic mashup created with Canva, showing Programming Historian logo

Workshop: Documenting Your Digital Methods

Graphic mashup created with Canva, showing Programming Historian logo

Workshop: Do You Need to Learn Programming? A Self-Critique

Map and grid graphic mashup

Training: Visualising Spatial Data in QGIS

Training Event

Training: Statistics and Visualisation with R

Training Event

Training: Intermediate Text Analysis

Data Carpentry for Social Scientists Poster - all info in description

CANCELLED - Training: Data Carpentry for Digital Humanities

Training Event

Training: An Introduction to Text Analysis

Data Carpentry for Social Scientists

Training: Data Carpentry for Social Scientists

Library Carpentry Graphic

Library Carpentry Workshop: OpenRefine

Peer Learning Group

Training: Painless Introduction to R

Graphic mashup

Training: Web Scraping News Sites with Python

Graphic mashup

Training: Introduction to Text Encoding with TEI

Graphic mashup

Training: Relational Databases and SQL

Notebook mashup

Training: Introduction to Markdown

Graphic mashup

Training: An Introduction to Databases using SQLite

Code Dojo

Code Dojo: Python

Graphic Mashup

Training: Visualizing Your Data Using R

3D Data Pathway

Training Pathways


The world of digital research methods can offer overwhelming possibilities, so with the help of researchers that have already implemented digital methods in their own work, CDCS is also building a series of online Training Pathways that will guide beginners through the steps and concepts they need to master new methodologies and signpost related training and support.

Ada Lovelace mashup

What to Expect

We offer a range of different types of training events. Learn about the different types of events we offer and what participants can expect when attending them.

old photograph of a group with basket with dot overlay

Our materials

We love sharing and recycling.  We use open resources in our work and make the materials we produce during our training available via GitHub. They range from markdown help pages to PowerPoint presentations to R and Python notebooks. All the material is covered by a CC-BY 4.0 license. We also support other open educational resources like The Programming Historian and TEI-By-Example.

mashup of text and image with the word information

Beyond CDCS

If you are interested in developing your skills, there are lots of options locally and further afield. From online courses to summer schools, our listings will help you identify what is available in the UK and beyond. 

mash up of key

Training Bursaries


The Centre for Data, Culture & Society offers a limited number of bursaries to allow members of staff and PhD students to develop their digital and computational skills by attending workshops, summer schools and other scholarly training events.


Apply Here

Our Training Fellows

a black and white image of a man wearing glasses and a baseball cap

Alex Crest

Alex Crest is a Training Fellow and PhD student in archaeology. His research focusses on online heritage and Roman frontiers. When not supporting the work of the EFI, he is an improvisor and writer for hire. His credits include Horrible Histories, Richard Herring's Can I Have My Ball Back, and Any Suggestions Doctor?!.

a woman in a raincoat sat on a rock with a view of an archipelago

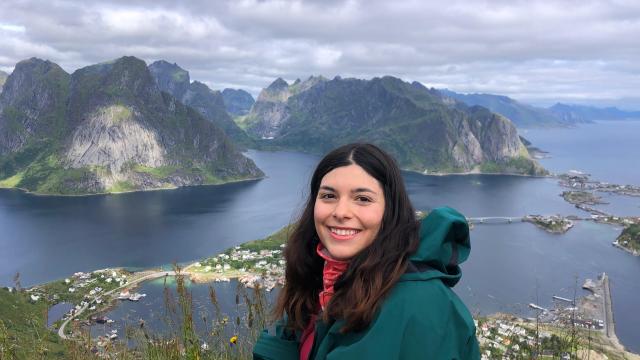
Aybuke Atalay

Dr. Aybuke Atalay is based in the School of Social and Political Science. After completing her PhD in Politics, she worked as a Teaching Fellow at SPS, where she taught the Introduction to Political Data Analysis course. Her doctoral research examined social media manipulation, focusing on the role of social bots in the Turkish Twittersphere. Her current work employs experimental approaches and computational methods to study political communication online. She served as Research Coordinator of the Social Data Science Hub (2023–2024) and was the co-organiser of SICSS-Edinburgh 2023.

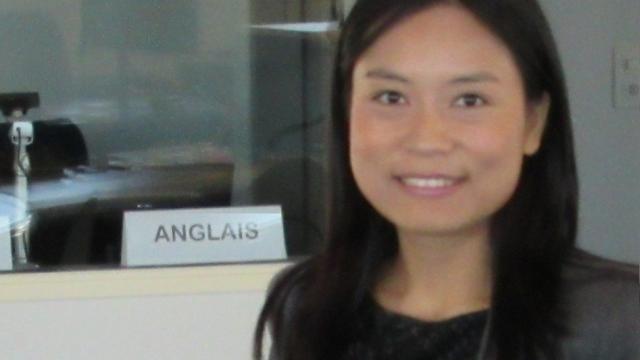
Brian Tsz Ho Wong

Brian Tsz Ho Wong

Brian Tsz Ho Wong is a PhD candidate (East Asian Studies) in the School of Literatures, Languages & Cultures. His research explores the networks of capital and power elites in the wartime Japanese Empire, and the use of private capital to fuel imperial ambitions. He is passionate about using digital tools (Gephi, QGIS and Google Earth) in his research. At CDCS, he is excited to teach and support the use of Gephi in humanities and interdisciplinary studies.
Chris Oldnell

Chris Oldnall

Chris is a PhD mathematics researcher with the MAC-MIGS Centre of Doctoral Training, who is affiliated with the Institute of Genetics and Cancer. His work is interdisciplinary and involves combining causal inference with genomics. He loves teaching individuals on how to get the most out of ‘big data’ by using data analysis techniques appropriately and accurately, and most importantly how to implement these in Python and R.
Image of Fang Jackson-Yang

Fang Jackson-Yang

Fang Jackson-Yang is based in the School of Philosophy, Psychology, and Language Sciences. Fang researches how people communicate prominent information in transitive events (e.g., “Jerry kicked the oil lamp”). She uses eye-tracking techniques to investigate when and how listeners make predictions of the endpoints of such events (e.g., the lamp fell on the floor). She also uses laboratory and digital corpus data to investigate how speakers use various sentence structures and other linguistic means to describe such events in different settings and what factors influence their choices.

a woman wearing glasses with a view over acity

Joy Lan

Joy is a PhD student at the Moray House School of Education and Sport, University of Edinburgh. Her study examines the role of non-profit organisations in shaping Taiwan’s educational policy and digital future, drawing on sociotechnical imaginaries and network governance as theoretical frameworks. 
Her work with CDCS involves applying digital methods to social research, including text extraction using OCR, version control using git and GitHub, and the use of pre-trained large language models (LLM) for text analysis.

Ki Tong

Ki Tong

Ki is a PhD candidate at the Advanced Care Research Centre studying ways to enhance greenspace accessibility for older adults. She is a landscape architect with professional experience delivering construction projects and landscape assessments. Besides an interest in using QGIS and ArcGIS for geospatial visualisation and analysis, she expanded her exploration with aggregating geospatial data and performing further analysis with R to study the correlation between environmental variables and urban density. 

Martin Disley

Martin Disley

Martin Disley is a practice-led design researcher based at the Institute for Design Informatics at the University of Edinburgh. His critical engineering studio practice blends artistic inquiry and investigative computing, producing outputs in software, film, installation, and text. His PhD research explores adversarial design and investigative aesthetics as Research through Design methods for explainability and interpretability of generative computer vision.

Prior to pursuing his PhD, he worked as a software developer for a music technology startup and as a research engineer at the University of Edinburgh.

a close up of the face of a man with glasses, wearing a black puffer jacket on a beach

Ponrawee Prasertsom

Ponrawee Prasertsom is a 4th year PhD student at the Centre for Language Evolution, PPLS. They use a range of quantitative methods from agent-based simulations to Bayesian statistics to experimentally and computationally study how commonalities across languages result from different pressures in learning and use. Ponrawee is also committed to promoting open research practices and increasing international access to research.

Rhys Davies

Rhys Davies

Rhys is based at the School of Health in Social Sciences.

Rhys is a psychologist researching adaptive behaviours and mental health in elite sports. His research makes use of statistical modelling with survey data, particularly investigating interactions to determine how context shapes the efficacy of “adaptive” behaviours. His preferred coding language is R, and he is passionate about using data visualisation techniques to communicate and simplify research findings.

a woman wearing a black bowler hat and a red scarf

Somya Iqbal

Somya is a systems thinker working across neuroscience, biology, data science, and the humanities to solve complex challenges in brain health and beyond. They lead analytical, user-led approaches to workflow design, integrating responsible AI, design thinking, and translational insight. Their cross-disciplinary portfolio spans research, teaching, and public engagement, with impact across clinical, academic, and societal domains.

A woman in a peach shirt and glasses sitting by a window.

Zongxiao Wu

Zongxiao Wu is a research fellow in corporate risk and machine learning in the Business School. Her research focuses on the measurement and management of financial risk, including credit risk modelling, natural language processing, and the application of large language models. Her preferred coding language is Python, and she is passionate about exploring the value of multimodal/alternative data in enhancing risk management processes.