Digital Method of the Month: Machine Learning


Have you seen a presentation on digital research methods and wondered if they are applicable to your work? Are you interested in learning new digital skills but unsure where to start?  

This is the right place for you!  

The digital method of the month meeting is a safe space to freely discuss the practicalities of learning and implementing a new digital skill in your research.  

Each month we select a method, and we have an honest discussion on what it takes to learn and master it. How much time will it take to get the basics? What are the software options available? What are the most common pitfalls? Where can you find more info on the subject? Etc...   

The method of this month is Machine Learning.  Machine learning is a branch of artificial intelligence (AI) focused on building applications that learn from data and improve their accuracy over time without being programmed to do so. In machine learning, algorithms are 'trained' to find patterns and features in massive amounts of data in order to make decisions and predictions based on new data. During the meeting we will briefly introduce the concept and discuss some of its real-world applications. 

No previous knowledge of the method is needed. This training event will be held via Microsoft Teams.  

Due to high demand for our training events, our cancellation and no-show policy applies to bookings for this event. Click here for details of this policy

You might be interested in

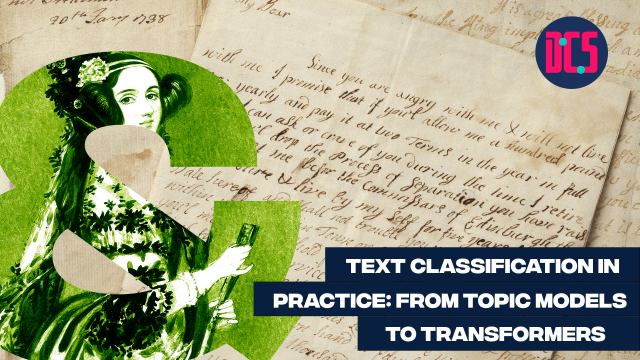
Graphic for a workshop titled ‘Text Classification in Practice: From Topic Models to Transformers.’ The background shows handwritten historical letters. A large green ampersand featuring an illustration of Ada Lovelace is placed on the left. The logo of the Centre for Data, Culture & Society (DCS) appears in the top right corner.

Text Classification in Practice: From Topic Models to Transformers

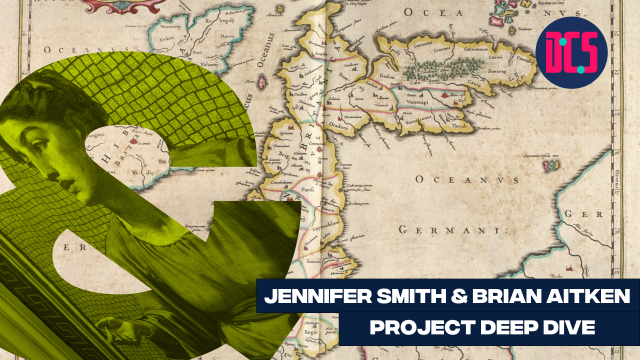
an old map of Acotland with the text "Jennifer Smith & Brian Aitken, Project deep Dive"

Who Speaks Scots Where: What Crowdsourcing Reveals

Graphic for a workshop titled ‘Getting Started with Descriptive Statistics.’ The background is a black-and-white photograph of people reading and working in a library. A large magenta ampersand featuring an illustration of Ada Lovelace is placed on the left. The logo of the Centre for Data, Culture & Society (DCS) appears in the top right corner.

Getting Started with Descriptive Statistics

a yellow tinged photo of people entering a building, with the text "Brad Rittenhouse, Project Deep Dive"

Giving Humanists a Helping Hand in HPC

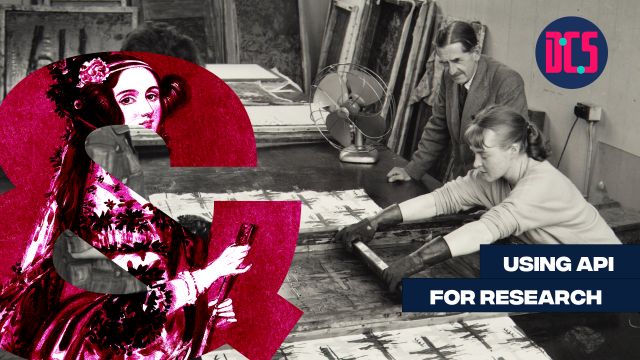
Graphic for a workshop titled ‘Using API for Research.’ The background is a black-and-white photograph of people working with printing equipment and patterned sheets. A large magenta ampersand featuring an illustration of Ada Lovelace is placed on the left. The logo of the Centre for Data, Culture & Society (DCS) appears in the top right corner.

Using API for Research

Graphic for an event titled ‘BYOD Festival.’ The background is a black-and-white photograph of people sitting around a table, drinking tea and playing cards. A large magenta ampersand featuring an illustration of Ada Lovelace is placed on the left. The logo of the Centre for Data, Culture & Society (DCS) appears in the top right corner.

Bring Your Own Data (BYOD) Fest

Graphic for a workshop titled ‘Data Viscualisation’ The background is a collage of historical printed text with an overlaid image of a wolf. A large green ampersand featuring an illustration of Ada Lovelace is placed on the left. The logo of the Centre for Data, Culture & Society (DCS) appears in the top right corner

Digital Method of the Month: Data Visualisation