Silent Disco: Working with Named Places: How and Why to Build a Gazetteer
Book Now
BOOK NOW
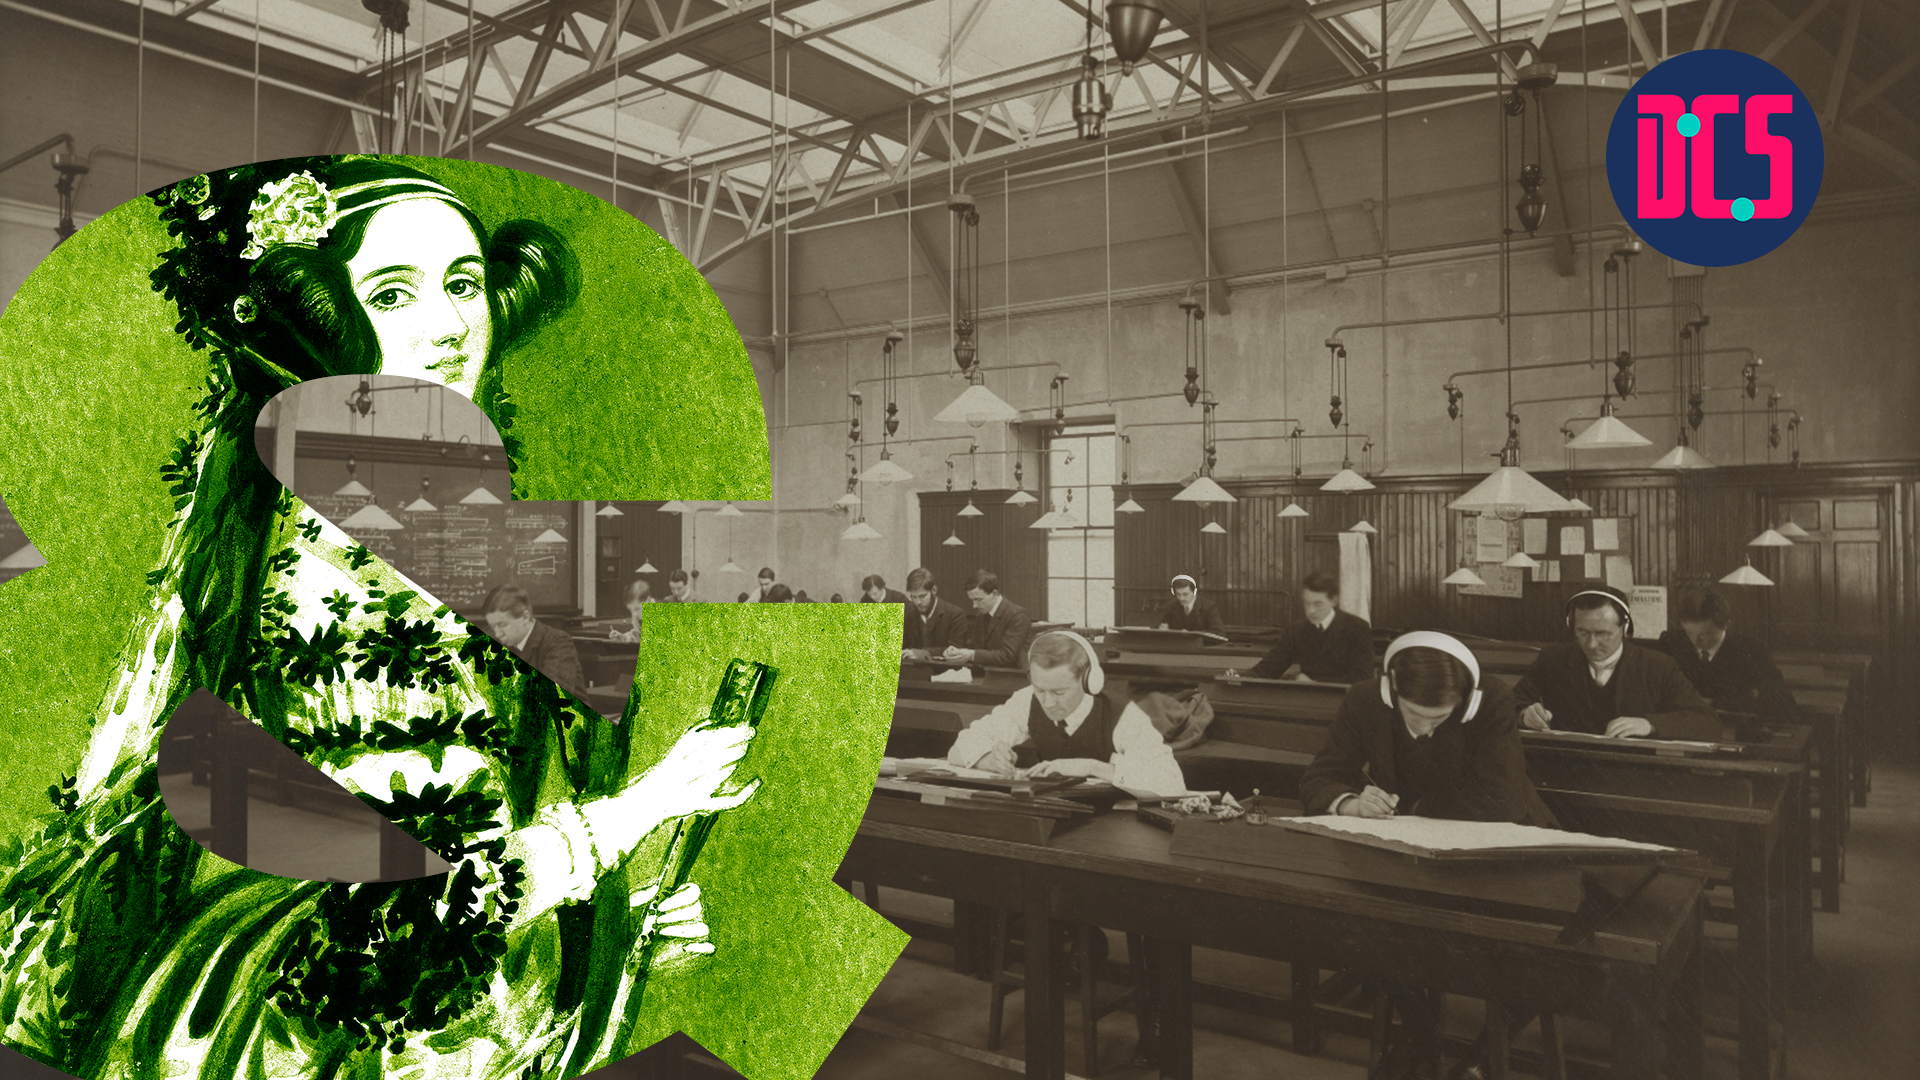
A sepia photograph of people working at desks in a large hall with overhead lamps. A large green ampersand featuring an illustration of Ada Lovelace is placed on the left. The logo of the Centre for Data, Culture & Society (DCS) appears in the top right corner.


Online 

Our 'Silent Disco' workshops are based on tutorials from the Programming Historian website. This training event will follow content from the tutorial, Working with Named Places: How and Why to Build a Gazetteer.  

This lesson teaches how to create a digital gazetteer from a historical text using the Linked Places Delimited (LP-TSV) format. A gazetteer records place names, spatial extents, and historical data, offering a structured knowledge system to connect places, events, and people across time. It is a key tool for spatial history and digital humanities.  

The workshop will take place via Microsoft Teams in a ‘Silent Disco’ format. Participants will work on the tutorial at their own pace. The facilitator will be available via Teams Chat to reply to any questions that arise during the workshop, and to help with installation, troubleshooting or other issues.   


This course will be taught by Ki Tong.


After taking part in this event, you may decide that you need some further help in applying what you have learnt to your research. If so, you can book a Data Surgery meeting with one of our training fellows.  

More details about Data Surgeries.  

Those who have registered to take part will receive an email with full details on how to get ready for this course.  

If you’re new to this training event format, or to CDCS training events in general, read more on what to expect from CDCS training. Here you will also find details of our cancellation and no-show policy, which applies to this event.  


Level   

This is a beginner-friendly course. No prior knowledge of the topic is required/expected, and the trainer will cover the basics of the method.   You will just need a basic understanding of using spreadsheet tools like Microsoft Excel, Google Sheets, or LibreOffice Calc. 


Learning Outcomes  

  • Understand the concept of place
  • Define what a gazetteer is and distinguish it from other forms of spatial information
  • Identify scenarios for which creating a gazetteer may be preferable to using a geographic information system
  • Transform a historical text into a gazetteer
  • Share a gazetteer with other platforms to enhance it and use it for analytical purposes 


Skills   

By attending this course, you will familiarise yourself with the following skills.  

  • Ability to create and structure a digital gazetteer from historical texts using the LP-TSV format.
  • Confidence in sharing and applying gazetteers across platforms to support spatial history and digital humanities research.


Explore More Training:


Return to the Training Homepage to see other available events


You might be interested in

graphic of a black and white Christmas tree background with colourful baubles and snowflakes. The text "Dorothy Berry, CDCS Annual Lecture 2025" is overlayed."

CDCS Annual Lecture 2025

black and white photograph of a person drinking tea out of a flaks on top of a hill.

CDCS December Fika

Graphic for a workshop titled ‘Introduction to Geographical Data with QGIS.’ The background shows an old map of the world with detailed illustrations. A large teal ampersand featuring an illustration of Ada Lovelace is placed on the left. The logo of the Centre for Data, Culture & Society (DCS) appears in the top right corner.

Intro to Geographical Data with QGIS

Graphic for a workshop titled ‘Data Viscualisation’ The background is a collage of historical printed text with an overlaid image of a wolf. A large green ampersand featuring an illustration of Ada Lovelace is placed on the left. The logo of the Centre for Data, Culture & Society (DCS) appears in the top right corner

Digital Method of the Month: Data Visualisation

Graphic for a workshop titled ‘Foundations of Webscraping.’ The background is a black-and-white photograph of students working together in a design studio with maps and models. A large teal ampersand featuring an illustration of Ada Lovelace is placed on the left. The logo of the Centre for Data, Culture & Society (DCS) appears in the top right corner.

Collecting Data from the Web: Foundation of Webscraping

Graphic for a workshop titled ‘Using API for Research.’ The background is a black-and-white photograph of people working with printing equipment and patterned sheets. A large magenta ampersand featuring an illustration of Ada Lovelace is placed on the left. The logo of the Centre for Data, Culture & Society (DCS) appears in the top right corner.

Using API for Research

Graphic for a workshop titled ‘Getting Started with Descriptive Statistics.’ The background is a black-and-white photograph of people reading and working in a library. A large magenta ampersand featuring an illustration of Ada Lovelace is placed on the left. The logo of the Centre for Data, Culture & Society (DCS) appears in the top right corner.

Getting Started with Descriptive Statistics

Graphic for a workshop titled ‘Getting Started with Inferential Statistics.’ The background is a black-and-white photograph of people studying in a library with partitioned desks. A large teal ampersand featuring an illustration of Ada Lovelace is placed on the left. The logo of the Centre for Data, Culture & Society (DCS) appears in the top right corner.

Getting Started with Inferential Statistics

Graphic for a workshop titled ‘Text Classification in Practice: From Topic Models to Transformers.’ The background shows handwritten historical letters. A large green ampersand featuring an illustration of Ada Lovelace is placed on the left. The logo of the Centre for Data, Culture & Society (DCS) appears in the top right corner.

Text Classification in Practice: From Topic Models to Transformers