Recording 3D Data: Lidar Scanner Tutorials

Graphic mashup created with Canva

IN PERSON 

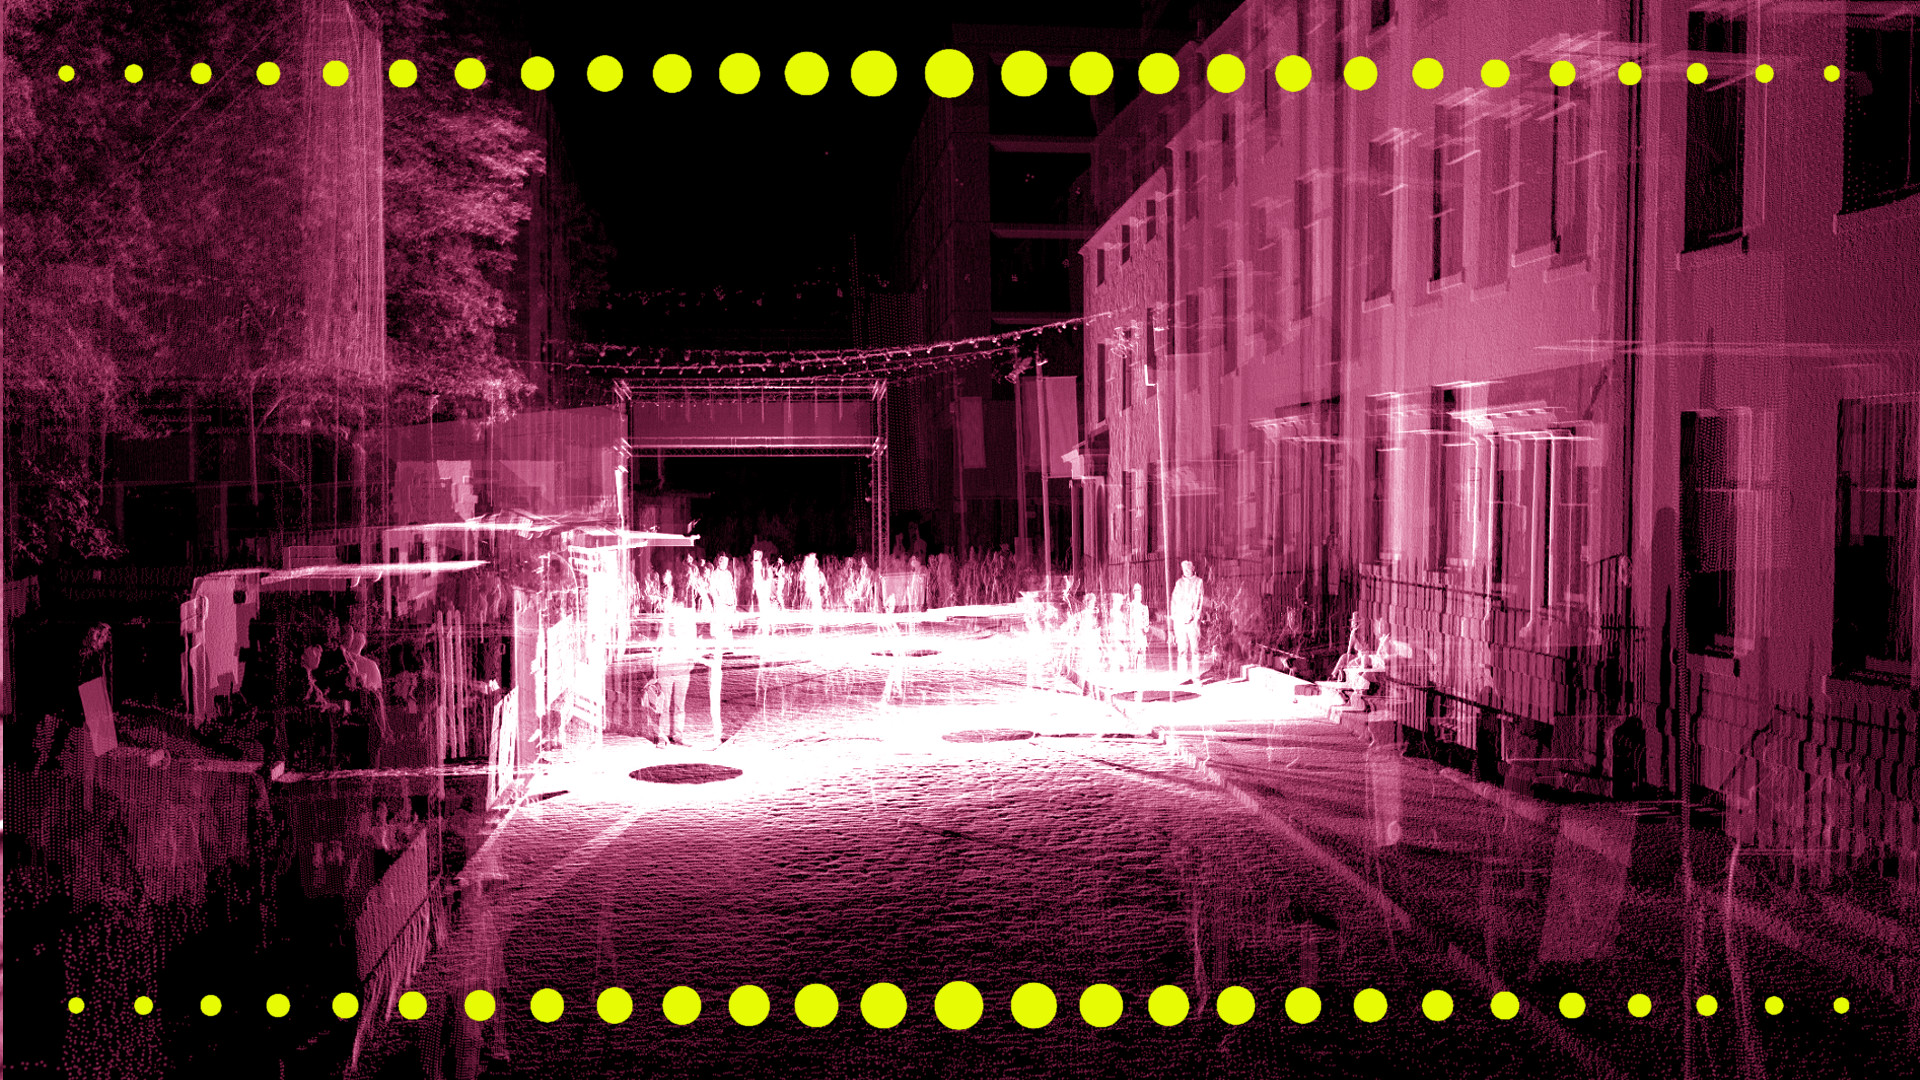
This two-part course introduces participants to LiDAR (laser imaging, detection, and ranging) which is a method for surveying 3-dimensionally using distances by targeting an object with a laser and measuring the time for the reflected light to return to the receiver.  It has terrestrial, airborne, and mobile applications.  

In the first session, you will learn how to operate the University of Edinburgh’s BLK360 LIDAR scanners. This session covers setup and data capture.  

In the second session, you will learn how to convert raw LIDAR scan data into point cloud format for use in a range of post-processing and analysis software.  

This is a beginner level event. No previous knowledge on the topic is required/expected and the trainer will cover the basics of the method.  

This event will take place in person at the Maker Space Studio.  

Those who have registered to take part will receive an email with full details on how to get ready for the course.  

If you’re new to this training event format, or to CDCS training events in general, read more on what to expect from CDCS training. Here you will also find details of our cancellation and no-show policy, which applies to this event. 


If you're interested in other training on working with 3D data, have a look at the following: 

Return to the Training Homepage to see other available events.    

You might be interested in

Graphic for a workshop titled ‘Getting Started with Inferential Statistics.’ The background is a black-and-white photograph of people studying in a library with partitioned desks. A large teal ampersand featuring an illustration of Ada Lovelace is placed on the left. The logo of the Centre for Data, Culture & Society (DCS) appears in the top right corner.

Getting Started with Inferential Statistics

Graphic for a workshop titled ‘Getting Started with Descriptive Statistics.’ The background is a black-and-white photograph of people reading and working in a library. A large magenta ampersand featuring an illustration of Ada Lovelace is placed on the left. The logo of the Centre for Data, Culture & Society (DCS) appears in the top right corner.

Getting Started with Descriptive Statistics

Graphic for an event titled ‘BYOD Festival.’ The background is a black-and-white photograph of people sitting around a table, drinking tea and playing cards. A large magenta ampersand featuring an illustration of Ada Lovelace is placed on the left. The logo of the Centre for Data, Culture & Society (DCS) appears in the top right corner.

Bring Your Own Data (BYOD) Fest

Graphic for a workshop titled ‘Working Collaboratively Through Version Control.’ The background is a black-and-white photograph of people weaving on large looms. A large magenta ampersand featuring an illustration of Ada Lovelace is placed on the left. The logo of the Centre for Data, Culture & Society (DCS) appears in the top right corner.

Working Collaboratively through Version Control

Graphic for a workshop titled ‘Using API for Research.’ The background is a black-and-white photograph of people working with printing equipment and patterned sheets. A large magenta ampersand featuring an illustration of Ada Lovelace is placed on the left. The logo of the Centre for Data, Culture & Society (DCS) appears in the top right corner.

Using API for Research

Graphic for a workshop titled ‘Data Viscualisation’ The background is a collage of historical printed text with an overlaid image of a wolf. A large green ampersand featuring an illustration of Ada Lovelace is placed on the left. The logo of the Centre for Data, Culture & Society (DCS) appears in the top right corner

Digital Method of the Month: Data Visualisation

an old map of Acotland with the text "Jennifer Smith & Brian Aitken, Project deep Dive"

Who Speaks Scots Where: What Crowdsourcing Reveals

Graphic for a workshop titled ‘Introduction to Geographical Data with QGIS.’ The background shows an old map of the world with detailed illustrations. A large teal ampersand featuring an illustration of Ada Lovelace is placed on the left. The logo of the Centre for Data, Culture & Society (DCS) appears in the top right corner.

Intro to Geographical Data with QGIS

Graphic for a workshop titled ‘Using Prompting Efficiently for Research.’ The background shows an aged, torn book page with visible text. A large green ampersand featuring an illustration of Ada Lovelace is placed on the left. The logo of the Centre for Data, Culture & Society (DCS) appears in the top right corner.

Using Prompting Efficiently for Research