Who Speaks Scots Where: What Crowdsourcing Reveals
Book Now
BOOK NOW


In-person

Dialectology has a long tradition of reaching out to the crowd to map language use across time and space (e.g. Ellis 1889). The 21st century has seen a resurgence in such studies, but in contrast to the face-to-face pen and paper questionnaires targeted at a socially restricted sample of speakers in traditional dialectology, these surveys utilise online technologies to reach out to the wider voices of the crowd. While these types of studies are still in their infancy, they have the potential to address an important gap in our understanding of how language varies and changes across multiple speakers, multiple dialects and multiple variables.

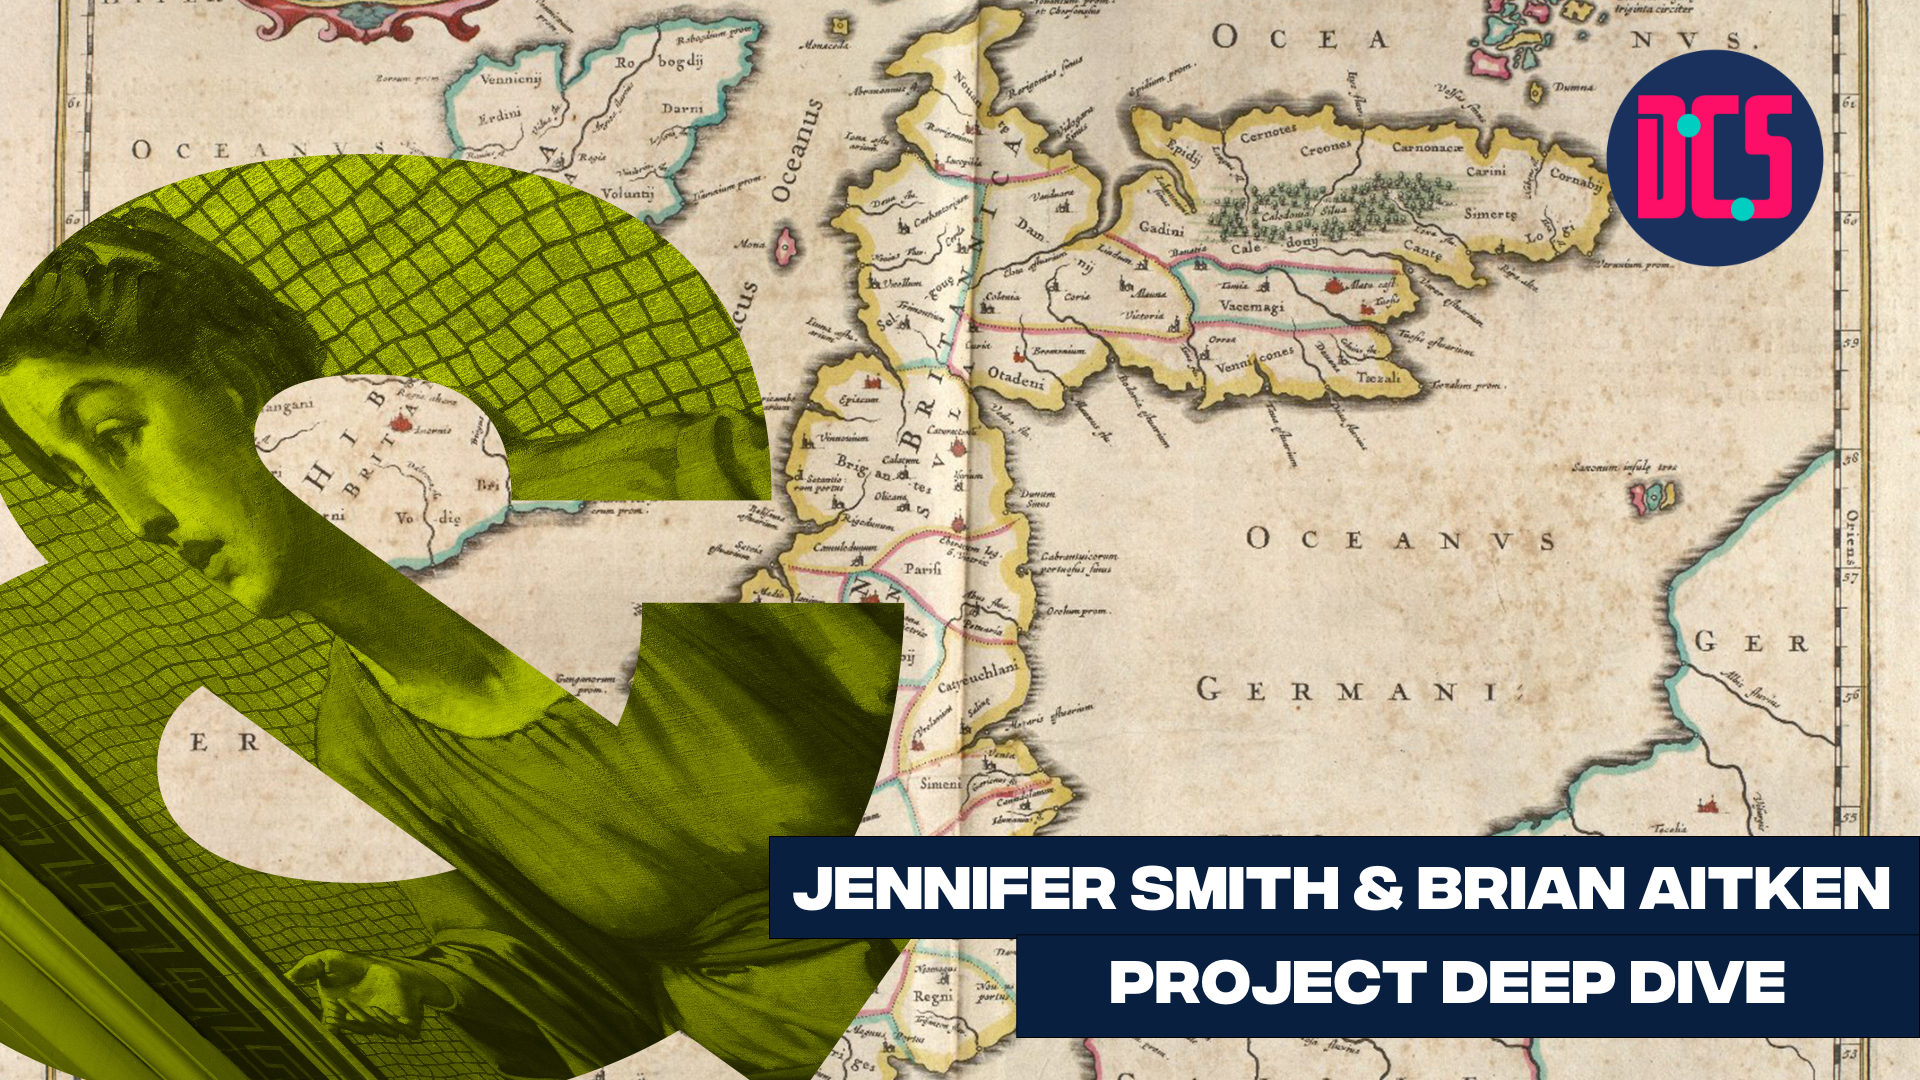
In this paper, Jennifer and Brian present findings from a new crowdsourced resource - Speak for Yersel (speakforyersel.ac.uk) - which sets out to map dialect use in Scots throughout Scotland. Specifically, who speaks Scots and where. They will begin by describing the creation of Speak for Yersel and then address the issue of sampling, and how the survey participants are distributed with respect to key demographic markers - age, gender, education and region. They will then turn to the areal view of Scots as afforded by Speak for Yersel, focusing on the reported use of phonetic and morphosyntactic dialect forms through time, space and the social system. The paper will end with a discussion of what crowdsourced data reveal with respect to the widely held assumptions on the Scots dialect landscape.


 

Room 2.55, Edinburgh Futures Institute

You might be interested in

graphic of a black and white Christmas tree background with colourful baubles and snowflakes. The text "Dorothy Berry, CDCS Annual Lecture 2025" is overlayed."

CDCS Annual Lecture 2025

Graphic for a workshop titled ‘Getting Started with Descriptive Statistics.’ The background is a black-and-white photograph of people reading and working in a library. A large magenta ampersand featuring an illustration of Ada Lovelace is placed on the left. The logo of the Centre for Data, Culture & Society (DCS) appears in the top right corner.

Getting Started with Descriptive Statistics

black and white photograph of a person drinking tea out of a flaks on top of a hill.

CDCS December Fika

Graphic for a workshop titled ‘Getting Started with Inferential Statistics.’ The background is a black-and-white photograph of people studying in a library with partitioned desks. A large teal ampersand featuring an illustration of Ada Lovelace is placed on the left. The logo of the Centre for Data, Culture & Society (DCS) appears in the top right corner.

Getting Started with Inferential Statistics

Graphic for a workshop titled ‘Using API for Research.’ The background is a black-and-white photograph of people working with printing equipment and patterned sheets. A large magenta ampersand featuring an illustration of Ada Lovelace is placed on the left. The logo of the Centre for Data, Culture & Society (DCS) appears in the top right corner.

Using API for Research

Graphic for a workshop titled ‘Using Prompting Efficiently for Research.’ The background shows an aged, torn book page with visible text. A large green ampersand featuring an illustration of Ada Lovelace is placed on the left. The logo of the Centre for Data, Culture & Society (DCS) appears in the top right corner.

Using Prompting Efficiently for Research

Graphic for a workshop titled ‘Introduction to Geographical Data with QGIS.’ The background shows an old map of the world with detailed illustrations. A large teal ampersand featuring an illustration of Ada Lovelace is placed on the left. The logo of the Centre for Data, Culture & Society (DCS) appears in the top right corner.

Intro to Geographical Data with QGIS