Book Launch: The Culture & Communities Mapping Project
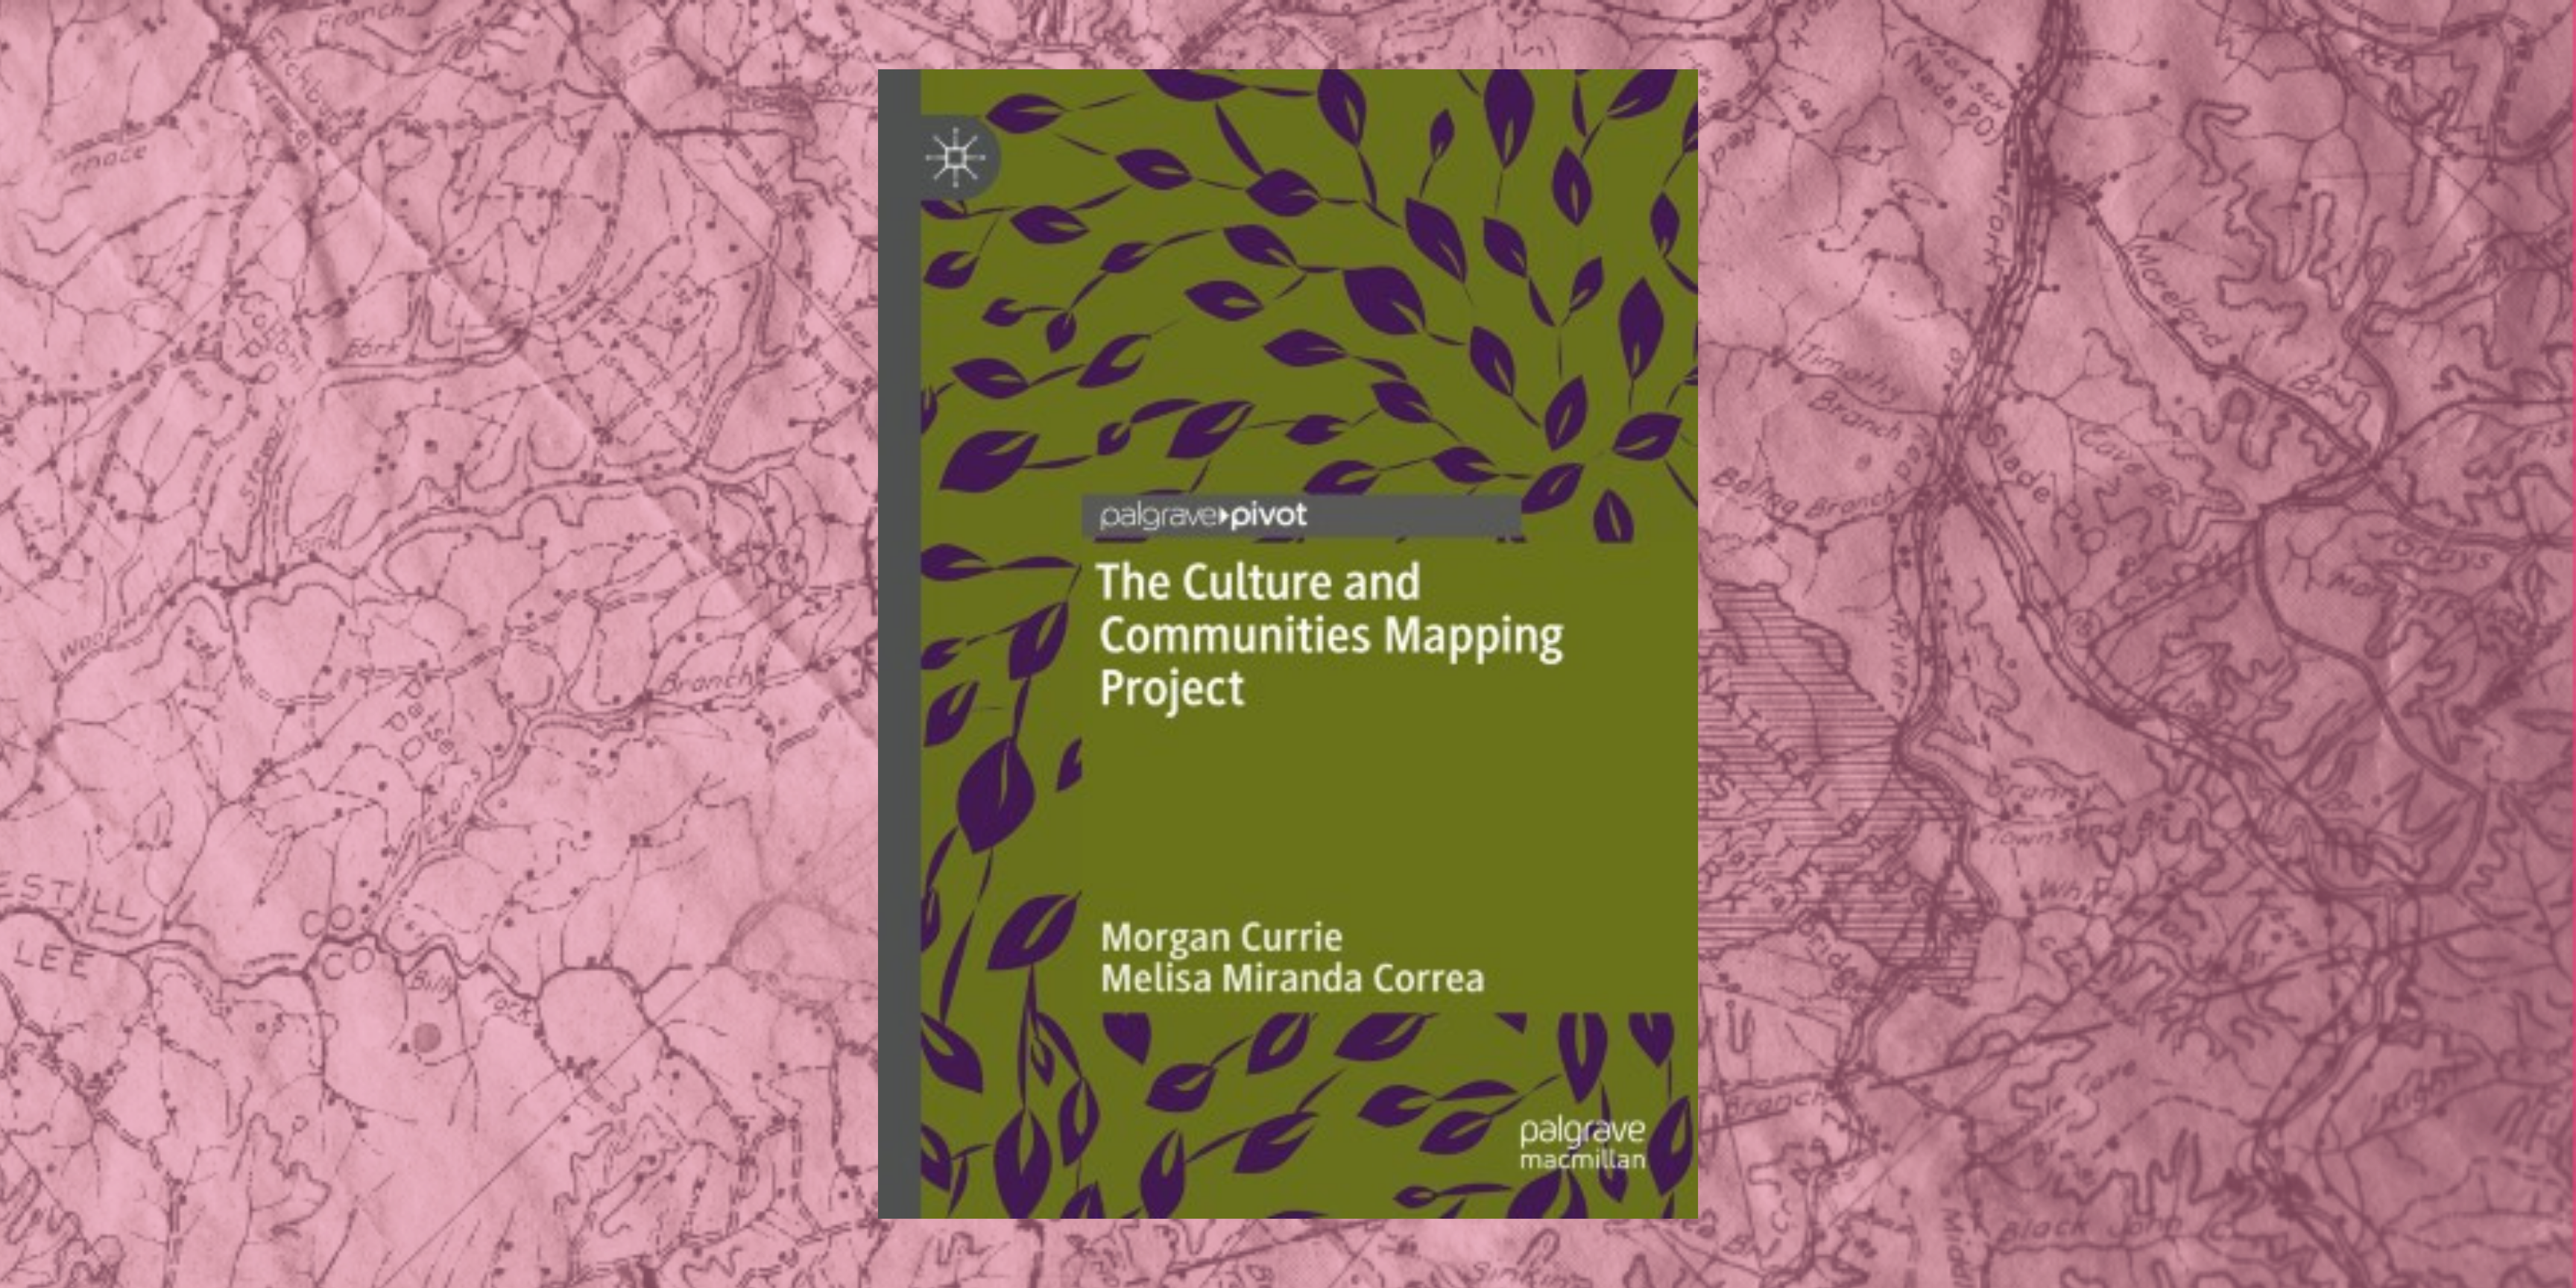
The Culture & Communities Mapping Project book cover

About the event:

Morgan Currie, Lecturer in Science, Technology & Innovation Studies, and Melisa Miranda Correa, PhD in Landscape Architecture, will read sections from their 2021 book The Culture & Communities Mapping Project (Palgrave). The book describes three years of using maps as an object of study and a method of research in the City of Edinburgh. Chapters discuss the theoretical foundations of cultural mapping and illustrate a variety of iterative mapping procedures and visual methodologies, from online virtual tours to photo elicitation, to capture the voices of inhabitants and their distinctive perspectives. Throughout, the authors reflect critically on how, through the processes of mapping, we create knowledge about space, place, community and culture.


The event will also feature talks by

Vikki Jones, Research Associate at Creative Informatics, discussing the event Future Culture Edinburgh, held in 2021 to prioritise community and under-represented voices and to open up conversation with stakeholders from across the city to imagine favourable futures for culture and inspire collective action.

Liz McFall presenting "We don't do digital, we dig it all": Experimenting with ‘Data Civics’ methods to support urban regeneration in Granton, Edinburgh. Liz will discuss initial observations from her latest project with Addie McGowan and Vassilis Galanos focussing on North Edinburgh, and the Granton shoreline area in particular. They draw inspiration from Patrick Geddes’ appropriation of the ‘camera obscura’, reimaging it for the contemporary context. The aim is to ‘see’ urban space from multiple perspectives and platforms, in environmental, governmental, technological, cultural and economic context.


The seminar talks will be followed by a drinks reception.

Inspace

1 Crichton Street

Edinburgh


You might be interested in

Graphic for a workshop titled ‘Getting Started with Inferential Statistics.’ The background is a black-and-white photograph of people studying in a library with partitioned desks. A large teal ampersand featuring an illustration of Ada Lovelace is placed on the left. The logo of the Centre for Data, Culture & Society (DCS) appears in the top right corner.

Getting Started with Inferential Statistics

black and white photograph of a person drinking tea out of a flaks on top of a hill.

CDCS December Fika

Graphic for an event titled ‘BYOD Festival.’ The background is a black-and-white photograph of people sitting around a table, drinking tea and playing cards. A large magenta ampersand featuring an illustration of Ada Lovelace is placed on the left. The logo of the Centre for Data, Culture & Society (DCS) appears in the top right corner.

Bring Your Own Data (BYOD) Fest

Graphic for a workshop titled ‘Text Classification in Practice: From Topic Models to Transformers.’ The background shows handwritten historical letters. A large green ampersand featuring an illustration of Ada Lovelace is placed on the left. The logo of the Centre for Data, Culture & Society (DCS) appears in the top right corner.

Text Classification in Practice: From Topic Models to Transformers

Graphic for a workshop titled ‘Introduction to Geographical Data with QGIS.’ The background shows an old map of the world with detailed illustrations. A large teal ampersand featuring an illustration of Ada Lovelace is placed on the left. The logo of the Centre for Data, Culture & Society (DCS) appears in the top right corner.

Intro to Geographical Data with QGIS

Graphic for a workshop titled ‘Data Viscualisation’ The background is a collage of historical printed text with an overlaid image of a wolf. A large green ampersand featuring an illustration of Ada Lovelace is placed on the left. The logo of the Centre for Data, Culture & Society (DCS) appears in the top right corner

Digital Method of the Month: Data Visualisation

Graphic for a workshop titled ‘Getting Started with Descriptive Statistics.’ The background is a black-and-white photograph of people reading and working in a library. A large magenta ampersand featuring an illustration of Ada Lovelace is placed on the left. The logo of the Centre for Data, Culture & Society (DCS) appears in the top right corner.

Getting Started with Descriptive Statistics

Graphic for a workshop titled ‘Using API for Research.’ The background is a black-and-white photograph of people working with printing equipment and patterned sheets. A large magenta ampersand featuring an illustration of Ada Lovelace is placed on the left. The logo of the Centre for Data, Culture & Society (DCS) appears in the top right corner.

Using API for Research

Graphic for a workshop titled ‘Using Prompting Efficiently for Research.’ The background shows an aged, torn book page with visible text. A large green ampersand featuring an illustration of Ada Lovelace is placed on the left. The logo of the Centre for Data, Culture & Society (DCS) appears in the top right corner.

Using Prompting Efficiently for Research