Our numbers have held steady this year, despite a challenging context locally. Our community continues to develop new projects and use our services. We have had another bumper year for training, whilst streamlining the programme and saving some costs. We have also focused less on social media this year, leaving Twitter and moving most of our events communications to Bluesky and local channels, including our mailing list which continues to grow apace.

Data
We have 14 PhD students affiliated with the Centre, two of whom are reps on our advisory board.
Over 3000 people subscribe to our weekly digest, where we share news and events.
We now have 12 research associates connected to CDCS.
Researchers submitted 16 project ideas submitted to this year's Digital Research Sandpit.
We have 91 repositories of training materials.
We helped over 20 researchers clear a technical hurdle.
Our publications are downloaded by hundreds of people.
We supported 13 projects this year.
We provided 2 reseachers with training bursaries this year.
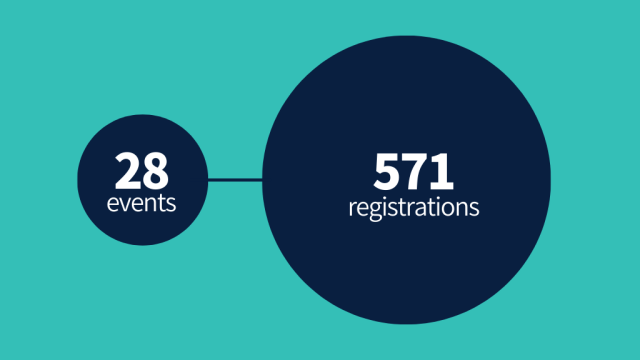
Almost 600 people registered to attend the 28 events that CDCS hosted in 24/25.
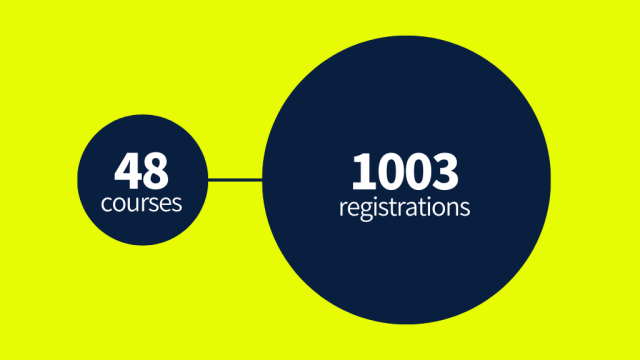
Over 1,000 people registered for our 48 training courses.
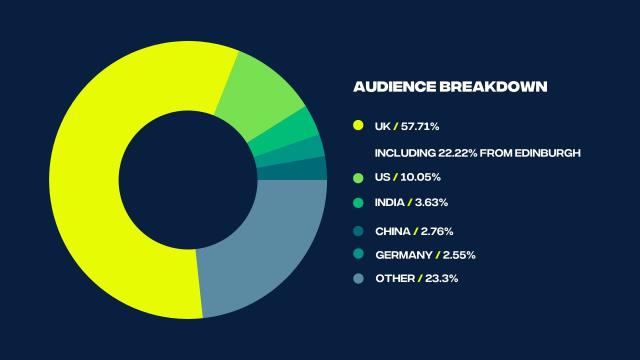
We have a strong local showing at our events, but about 25% of our audience joins us virtually from around the world.
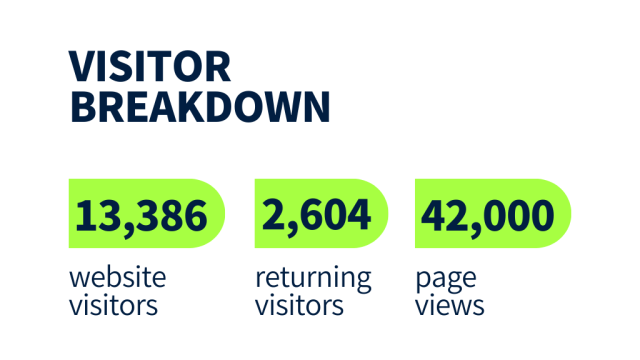
Over 13,000 people have visited our website. Around one in five visitors returned multiple times.
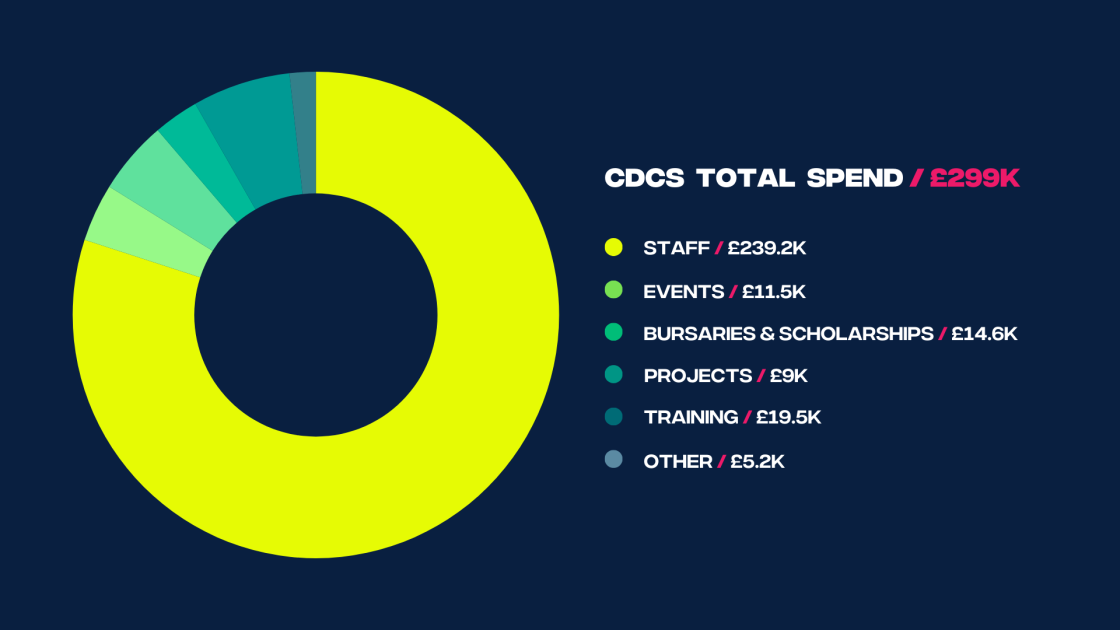
This year we have increased our spend on events, bursaries and projects. We streamlined our training programme, which brought down cost slightly from last year, but it remains our biggest spend after staffing.