While this last year has presented many challenges, it has also been a period of remarkable growth for the Centre. Our seminar audience more than doubled from last year with attendees joining us from around the world. The number of visitors to our website has also doubled and the percentage of returning visitors has grown. Our stakeholder forum has increased in size, as has our email list, and our Twitter following has grown by almost 60%. We’ve been able to support 20 projects, up from 8 in our first year, including some developed in response to the pandemic. Finally, we have offered 15 new training courses on top of last year’s programme, with take up remaining at pre-Covid levels, which is incredible given the other demands our community faced during this difficult time.
CDCS DATA
We now have nineteen affiliated PhD students doing brilliant data-led research on everything from handwriting recognition, to macroeconomics, to inclusion.
We are growing our networks and are proud to now have three external research affiliates.
Our bursaries usually pay for travel, but this year we helped two researchers attend online courses instead.
We've been thrilled to see one of our pilots grow into a large AHRC-funded project.
We've provided tailored support to twenty research projects this year, using tools from text-mining to virtual reality.
Following our support with their projects, four researchers are currently drafting articles for publication.
The twenty-nine members of our stakeholder forum give us feedback and help ensure that we support our community effectively.
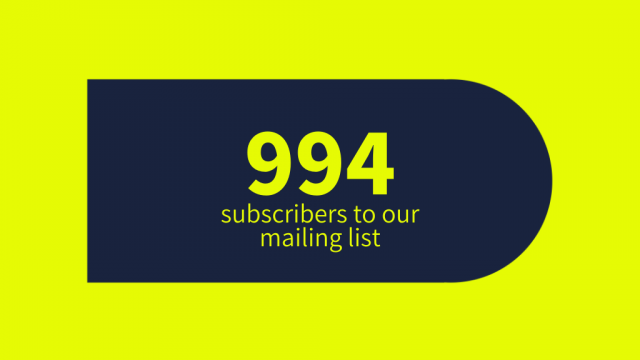
Almost one thousand people get our weekly digest which shares information about our events and training.
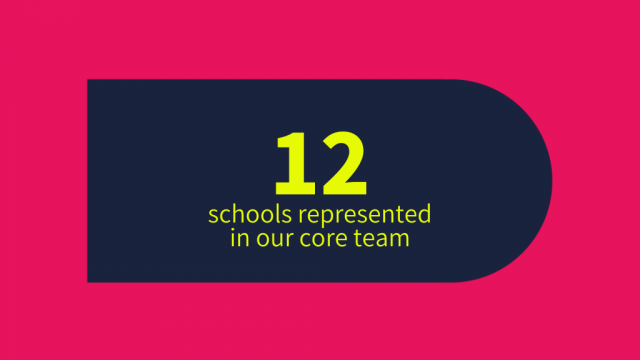
Our team represents disciplines from History and Archaeology to Linguistics and Economics.
Events
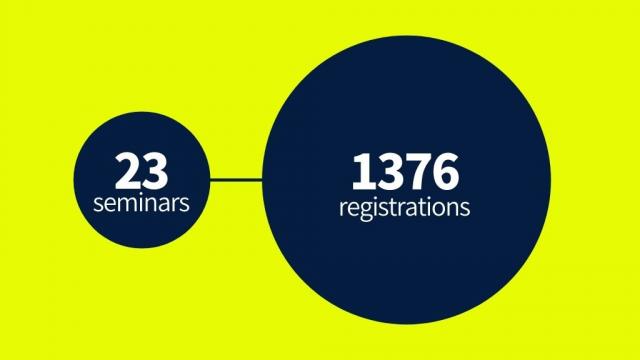
Switching to online events helped us grow our audience this year: almost 1400 people registered for 23 events.
Training
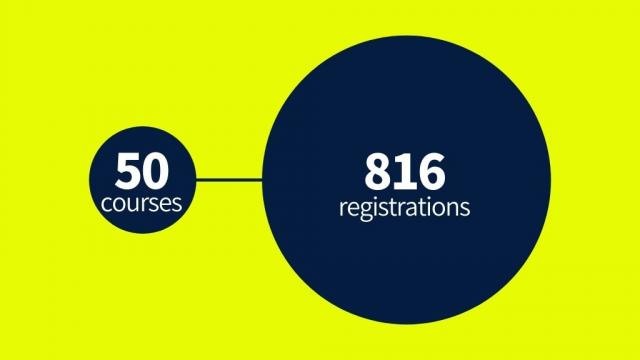
We offered 50 online courses this year, with over 800 people signing up to develop their skills.
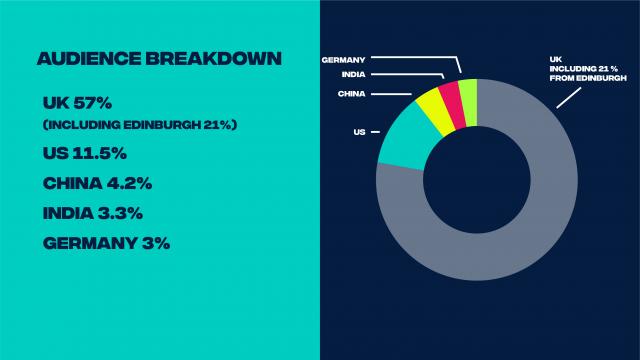
Audience Breakdown
Our website is visited by people from all over the world, but it also sees lots of local traffic with 21% of all visitors based in Edinburgh.
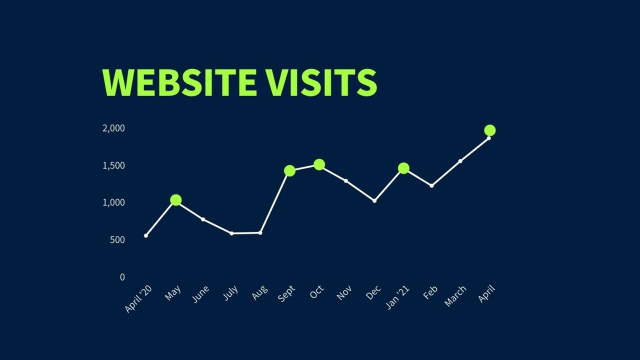
website visits
We're seeing steadily increasing traffic to our site this year, and have refreshed our website this spring.
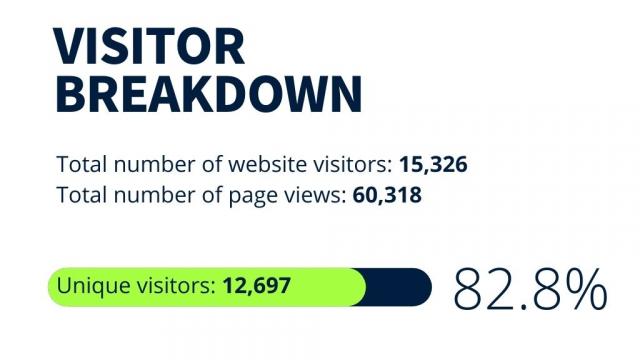
Visitor Breakdown
There were over 12 thousand unique visitors to our site, and almost 20% were returning.
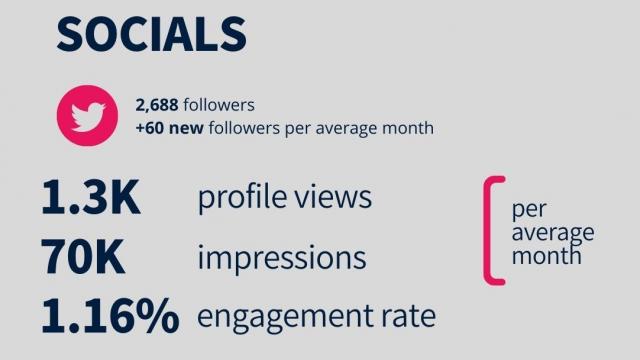
social media
We actively engage with our community on Twitter: we have 2688 followers and our tweets are seen by thousands more.
Budget
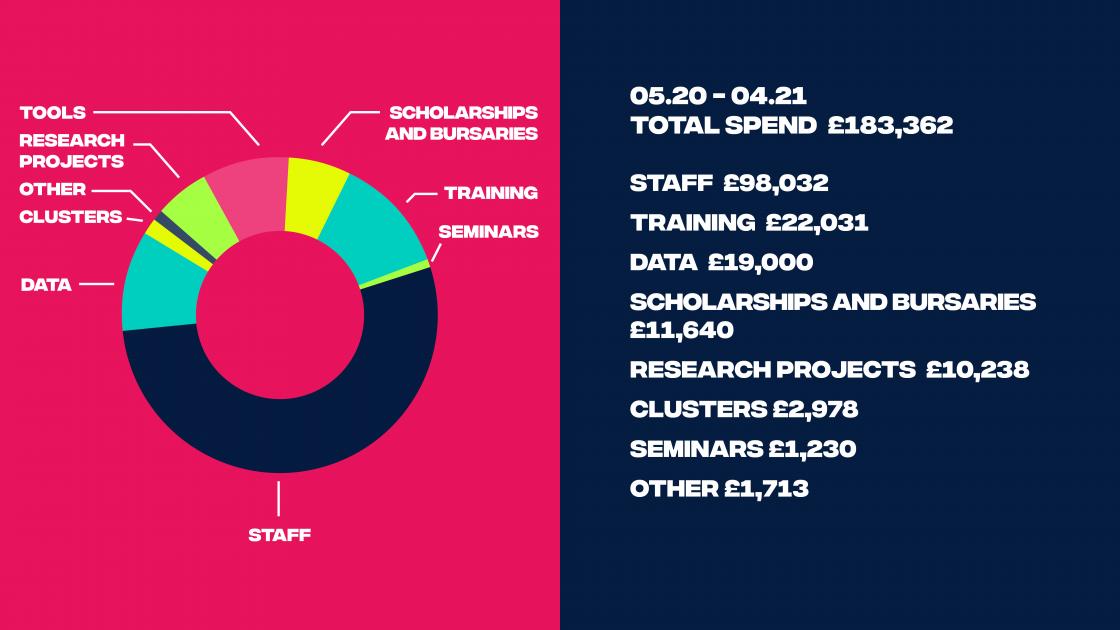
From May 2020 to April 2021, our budget was £183,362.00. Of this, staff costs were the highest proportion at just over £98,000. We spent £22,000 on training, £19,000 on Data, and £11,600 on scholarships and bursaries. Around £13,000 was channelled to research projects and clusters. With our move online, our reduced seminar costs were £1,230.